12 Data-Driven ways to boost e-commerce conversions
Improving your store’s conversion rate means more sales with the same amount of traffic. That’s why data analytics should be part of your everyday toolkit. It helps you understand how users behave, where they drop off, and what gets them to click “buy.”
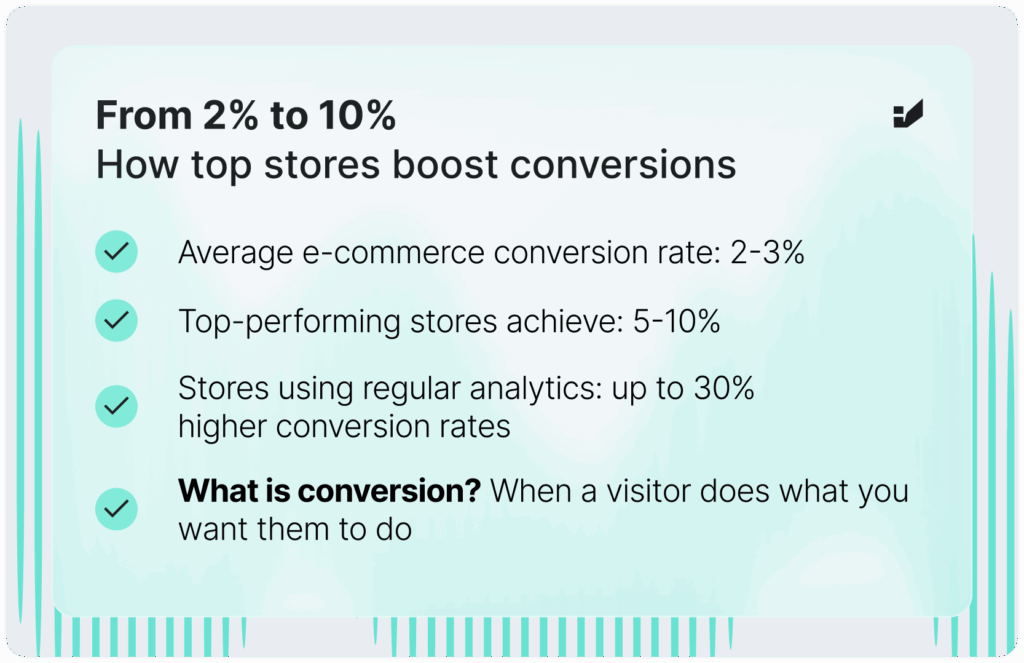
Shops that regularly analyze their data and adjust their user experience can see conversion rates up to 30% higher than those that skip this step. The average rate in e-commerce sits at 2–3%, but top-performing stores hit 5-10%.
So what exactly is a conversion? It’s when a visitor does something you want them to do – like make a purchase. Seems simple, but optimizing for it takes strategy.
Below are 12 proven methods that use analytics to improve conversions. Each comes with examples and tips to help you apply them in your store.
1. Advanced user behavior tracking
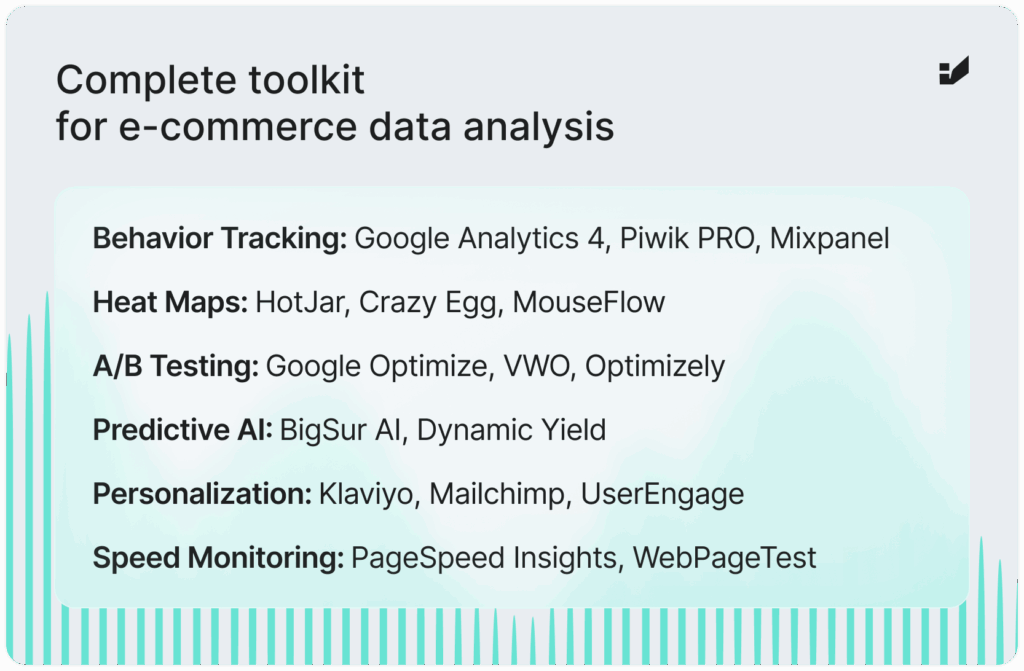
Understanding how users move through your site starts with the right tools. Google Analytics 4, Piwik PRO, and Mixpanel let you dig into specific interactions – clicks, scrolls, time on page – and spot where users drop off.
What to track:
• Clicks on key buttons (like “Add to Cart”)
• Scrolling depth
• Time spent on product pages
• Bounce rates on high-traffic pages
• Navigation paths between sections
Use Enhanced Ecommerce in GA4 to see product impressions, clicks, cart additions, and purchases in detail. This helps you spot friction points and test solutions quickly.
Example:
A Polish men’s fashion store discovered that 68% of users were leaving at the size selection step. By adding a clear size chart and fit recommendations, they reduced drop-off by 23% and saw a 15% increase in conversions.
2. Heat maps and session recordings
If you want to see how users interact with your store, heat maps and session recordings are the way to go. Tools like HotJar, Crazy Egg, or MouseFlow give you visual insights – where people click, how far they scroll, and where they get stuck.
What to look for:
- Click maps that show users clicking on non-clickable elements – often a sign of poor interface design
- Scroll maps that reveal whether CTAs and key content are placed high enough on the page
- Session recordings that highlight hesitation, frustration, or form errors
- “Dead clicks” – repeated clicks with no response, which suggest broken elements or unclear expectations
Example:
A natural cosmetics store from Krakow saw that most users didn’t scroll past the first screen of the homepage. After moving top products higher up, clicks on those items jumped by 47%, and the conversion rate went up by 12%.
3. A/B testing to boost conversions
A/B testing helps you make decisions based on data, not guesswork. Tools like Google Optimize, VWO, or Optimizely let you compare different versions of your page to see which one performs better.
What to test:
- CTA buttons: color, size, text, placement, shape
- Product headlines: tone, length, keyword use
- Page layout: structure, hierarchy, grid vs list view
- Forms: number of fields, order, labels, helper text
- Product photos: style, quantity, with or without models
- Promotions: discount type (percent vs fixed amount), how it’s shown
Testing tips:
- Start with a clear hypothesis like “Changing the button color from blue to orange will increase CTR by 5%”
- Make sure your sample size is large enough – at least a few hundred conversions
- Run tests for 1 to 2 weeks to avoid time-based bias
- Test one element at a time to know what caused the change
Example:
An electronics store in Warsaw tested two “Buy Now” buttons – green and red. The red button increased conversions by 21%. Next, they tested button text and found “Order Now” led to 8% more conversions than “Buy Now.”
4. Conversion funnel optimization
Analyzing your conversion funnel with tools like Google Analytics, Adobe Analytics, or Mixpanel helps spot where users drop off during the purchase process. With this data, you can make changes to improve how many users finish their transactions.
What to check:
- Abandonment rate at each step (cart, delivery info, payment)
- Time spent on each stage
- Differences in behavior between new and returning users
- How device type (desktop vs mobile) affects completion
- Effectiveness of different navigation paths
Ways to improve:
- Let users save their cart even if they’re not logged in
- Allow guest checkout without mandatory registration
- Cut down the number of checkout steps
- Add a progress bar showing where the user is in the process
- Use automated form filling, like address lookup by postal code
- Provide payment options popular in your region, such as quick transfers or deferred payments
Example:
A furniture store in Gdansk saw 67% of users drop off while entering their address. After adding automatic address completion based on postal codes and simplifying the form, the completion rate rose by 39%. This led to 22% more finished orders.
5. Customer segmentation for targeted actions
Segmenting users by demographics, behavior, or traffic source helps create personalized campaigns. CRM tools like Klaviyo, Mailchimp, or UserEngage make it easier to tailor messages for specific groups, boosting engagement and conversion.
Example segments to consider:
- Purchase frequency: one-time, occasional, regular, VIP
- Customer lifetime value: low, medium, high
- Product preferences: categories, brands, price ranges
- Acquisition source: social media, SEO, paid ads, referrals
- Demographics: age, gender, location, language
- Behavior: browsed categories, time spent on site, mobile vs desktop
Personalization ideas for segments:
- VIP customers: loyalty programs, early access to new products, dedicated support
- One-time buyers: offers encouraging repeat purchases, win-back campaigns
- Cart abandoners: reminder emails, limited-time discounts
- Fans of specific categories: personalized recommendations, promo alerts
Example:
A sports store in Wroclaw identified a “running enthusiasts” segment based on purchase history and browsing. They sent targeted emails with training tips and product suggestions, increasing email conversion rates by 35% compared to standard newsletters.
6. Predictive analytics for personalization
Predictive analytics uses AI to anticipate customer needs and offer personalized recommendations. Tools like BigSur AI, Dynamic Yield, or NapoleonCat help adjust offers dynamically, encouraging more purchases.
How predictive analytics can be used:
- Predict the next purchase based on past behavior and similar users
- Adjust prices dynamically according to demand and buying patterns
- Optimize when to send marketing messages based on user activity
- Detect risk of churn and trigger retention campaigns automatically
- Recommend complementary products by analyzing the shopping cart
How to start:
- Combine data from your store, CRM, marketing, and customer service for a full picture
- Pick an AI tool that fits your business size and data volume
- Begin with simple models like product recommendations, then expand gradually
- Check algorithm performance regularly and tweak as needed
Example:
A children’s store in Poznan used an AI recommendation system that looked at the child’s age and past purchases. It sent personalized emails with relevant products for the child’s development stage. This boosted email revenue by 41% and increased conversion by 18%.
7. Monitoring site speed
Page loading speed plays a key role in conversion. Tools like Google PageSpeed Insights, WebPageTest, or Lighthouse help spot elements that slow your site down, such as large images. Optimizing these improves user experience.
Key metrics to track:
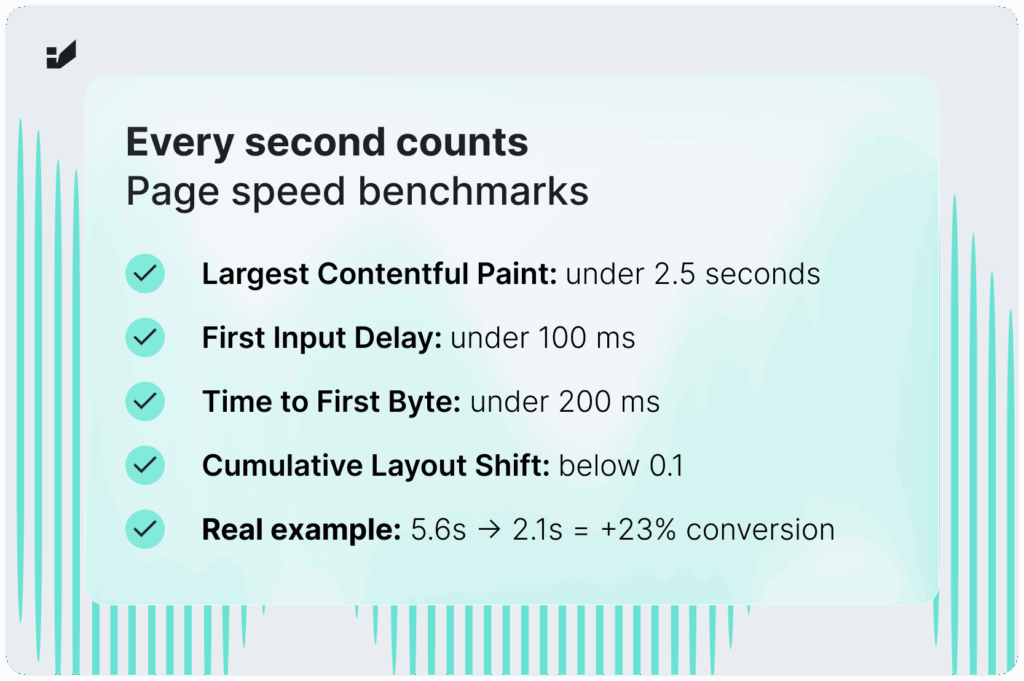
- Largest Contentful Paint (LCP): time to load the largest page element (should be under 2.5 seconds)
- First Input Delay (FID): delay between user interaction and page response (should be under 100 ms)
- Cumulative Layout Shift (CLS): measures visual stability during loading (should be below 0.1)
- Time to First Byte (TTFB): time from request to first data received (should be under 200 ms)
Optimization tips:
- Compress and optimize images (use WebP or AVIF formats)
- Use lazy loading for off-screen content
- Minimize CSS and JavaScript, removing unused code
- Enable browser caching via HTTP headers
- Use a CDN for faster resource delivery
- Implement server-side rendering (SSR) for quicker content display
- Optimize web fonts and limit their number
Example:
A home electronics store in Łódź audited its site speed and found uncompressed images were causing 5.6-second loading times. After adding automatic image compression, lazy loading, and CSS optimization, loading dropped to 2.1 seconds. This boosted conversion by 23% and lowered bounce rate by 15%.
8. Enhancing product pages
Analyzing how users interact with product pages helps identify which elements drive interest and sales. Testing different versions uncovers what works best.
Elements to optimize:
- Product photos: quantity, quality, zoom options, 360° views
- Product descriptions: length, style, structure, focus on benefits vs. features
- Technical specifications: clarity, completeness, easy comparison
- Product availability: clear presentation of stock status
- Reviews and ratings: visibility, format, filtering options
- Related product recommendations: relevance, display, placement
- Calls to action (CTAs): visibility, wording, design
Testing approach:
- Run A/B tests on product page variants
- Use heat maps to see which parts users focus on
- Track time on page, conversion rate, and bounce rate
- Gather user feedback via surveys and forms
Example:
A cosmetics store in Szczecin ran A/B tests on ingredient presentation. The version that divided ingredients visually into natural and artificial, with short explanations of key ingredients’ effects, boosted product conversion by 27% compared to a plain list.
9. Simplifying the purchase process
A complex checkout can drive customers away. Analyzing the purchase funnel helps spot problem points, like too many form fields. Fixing these makes completing the purchase easier.
Best practices:
- Keep forms to necessary fields only, remove optional ones
- Add auto-complete to speed up data entry
- Offer guest checkout as the default option
- Show all costs (shipping, taxes) clearly before finalizing
- Display order summary at every step
- Provide payment methods your customers prefer
- Use a progressive form design, showing one step at a time
Mobile optimization:
- Use bigger buttons and fields for easier tapping
- Adjust keyboard type to the data (e.g., numeric for phone)
- Reduce scrolling and screen switching
- Use device features like camera for card scanning
Example:
A clothing store in Bydgoszcz cut checkout steps from five to three and reduced form fields by 40%. This raised the purchase completion rate from 32% to 51%, adding 115,000 PLN in monthly revenue.
10. Utilizing social proof
User-generated content like reviews builds trust. Analytics help track how these elements impact buying decisions and guide how to present them, such as highlighting positive feedback on key pages.
Types of social proof to use:
- Product reviews and ratings with filtering and sorting options
- Popularity counters (“Purchased 500 times”)
- Customer video reviews and photos showing product use
- Recommendations from experts or influencers
- Real-time activity indicators (“15 people are viewing this product”)
- Labels like “bestseller” or “customers’ choice”
- Industry certificates and awards that confirm quality
Implementation strategies:
- Automatically send review requests after purchase
- Offer incentives for detailed reviews (e.g., discounts on next purchase)
- Highlight the most helpful reviews at the top
- Place short customer quotes at key points in the purchase path
- Integrate with trusted review platforms (e.g., Trusted Shops, Opineo)
Example:
A dietary supplement store in Katowice added a review system with filtering by health issues. Products with over 50 reviews converted 93% better than those with fewer than 10. After a campaign that boosted reviews by 175%, the store’s average conversion rate grew by 34%.
11. Data-driven personalization
Personalizing the shopping experience based on browsing history or past purchases boosts engagement. Tools like Klaviyo, Insider, or Exponea help tailor recommendations and messages, leading to higher conversion rates.
Levels of personalization:
- Basic: customization by demographics and location
- Medium: based on browsing and purchase history
- Advanced: real-time personalization based on current behavior
- Predictive: AI-driven predictions of preferences and intentions
Elements to personalize:
- Homepage: featured categories and promotions
- Product recommendations: “For You,” “Complete Your Purchase”
- Email communication: content, timing, and offers
- Banners and pop-ups: content, offer, and timing
- Search engine: prioritizing relevant results
- Prices and promotions: personalized deals for different segments
Example:
A home goods store in Torun personalized its homepage to show product categories based on users’ browsing history. They also sent personalized emails with recommendations for products that complemented previous purchases. This raised the conversion rate by 29% and increased average order value by 17%.
12. Continuous monitoring of key indicators
Regularly analyzing key performance indicators (KPIs) like conversion rate or cart abandonment is crucial for ongoing optimization. Tools such as Google Data Studio, PowerBI, or Datalix help visualize data, making it easier to spot trends and make informed decisions.
Key indicators to monitor:
- Conversion rate (overall and by segment)
- Average order value (AOV)
- Customer acquisition cost (CAC)
- Cart abandonment rate
- Customer return rate
- Customer lifetime value (LTV)
- Return on advertising spend (ROAS)
- Page engagement (time on page, scroll depth)
Effective monitoring strategies:
- Build personalized dashboards for different teams
- Set clear alert thresholds for important metrics
- Analyze data over various periods (daily, weekly, monthly, yearly)
- Compare current results with past periods and campaigns
- Hold regular team reviews of data insights
- Document all changes to track their impact on KPIs
Future directions in e-commerce analytics
Data is at the heart of successful online stores today. Using it well helps businesses sell more, understand customers better, and improve how they work. The tools for analyzing data are getting smarter, and companies that use them can react faster to what customers want.
Here are some key trends shaping e-commerce analytics:
- Real-time prediction: AI will soon predict what customers want to buy while they browse and offer personalized suggestions instantly.
- Emotion and sentiment analysis: New tools will read customer feelings from reviews or social media to help tailor communication.
- Voice commerce analytics: As more people shop by voice, we’ll see new ways to track and analyze those interactions.
- Omnichannel data integration: Combining data from online, offline, mobile, and social channels will give a clearer picture of customer journeys.
- Easier access to analytics: Cloud-based, user-friendly tools will make analytics available to smaller businesses too.
- Privacy-focused analytics: With stricter rules like GDPR and less third-party data, first-party data will become more important.
To get started with analytics in your online store:
- Check what tools and data you already have.
- Set clear goals you want to improve with data.
- Pick tools that fit your business size and needs.
- Set up tracking and tagging properly.
- Train your team to use the data.
- Regularly review your data and make changes based on insights.
- Keep testing new ideas and improving your process.
At Insightland, we help online stores use data effectively to grow and improve customer experience. Reach out if you want to learn how to make the most of your data.