12 Data-Driven ways to boost e-commerce conversions
Improving your store’s conversion rate means more sales with the same amount of traffic. That’s why data analytics should be part of your everyday toolkit. It helps you understand how users behave, where they drop off, and what gets them to click “buy.”

Key takeaways
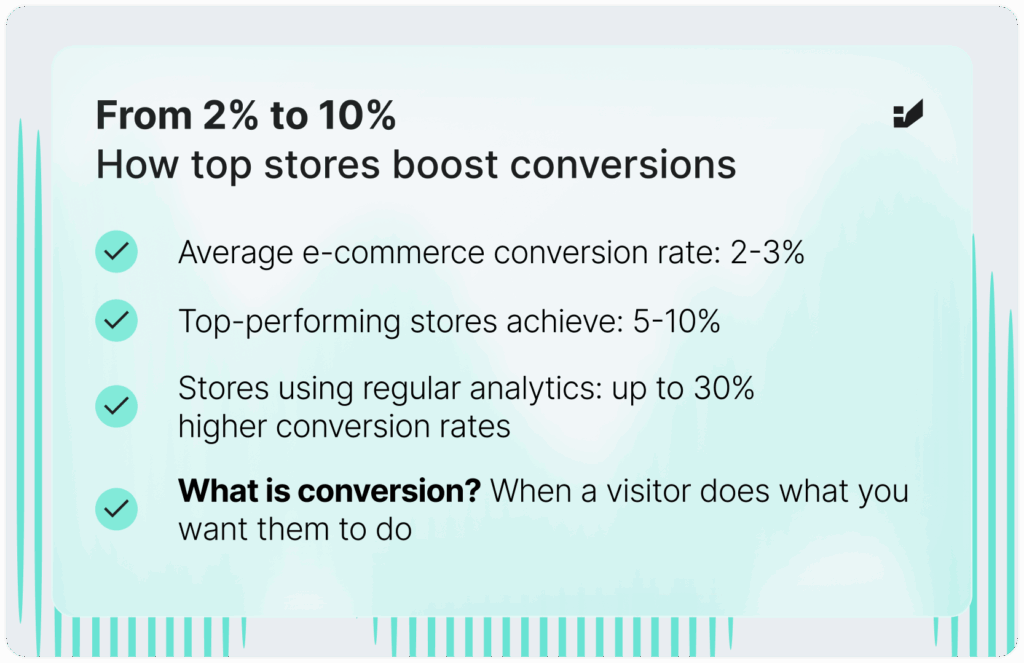
- The average e-commerce conversion rate is about 2–3%. IRP Commerce recorded 2.26% in July 2026; the top 10% of Shopify stores convert at 4.7% or more.
- The biggest leaks are usually in checkout. About 70% of carts are abandoned (Baymard), most often because of unexpected extra costs.
- Speed pays. A 0.1-second faster mobile site lifted retail conversions by 8.4% in a Deloitte study for Google.
- Start with measurement, then test. Track the funnel in GA4, find the biggest drop-off, form a hypothesis and A/B test the fix.
- Don’t forget AI search. Visits referred by AI assistants converted 31% better than other traffic in Adobe’s US retail data (holiday 2025).
Improving your conversion rate means more sales from the same traffic. Data shows you where users drop off and why, so you can fix the right things first instead of guessing.
A conversion is any action you want a visitor to take: most often a purchase, but also adding to cart, signing up or contacting you. Below are 12 data-driven methods, with tools, metrics and tips, plus benchmarks to judge where you stand.
Let your customers find you, wherever they look.
What is a good e-commerce conversion rate?
| Benchmark | Value | Source |
|---|---|---|
| Average e-commerce conversion rate | 2.26% (July 2026) | IRP Commerce via Blend Commerce |
| Global rolling 12-month average | 2.72% | Dynamic Yield via Blend Commerce |
| Top 20% / top 10% of Shopify stores | 3.2% / 4.7% | Littledata via Eightx |
| Average cart abandonment rate | about 70% | Baymard Institute |
Benchmarks vary widely by industry, price point, device and traffic source. Food and beauty stores convert far higher than furniture or luxury. Compare yourself with your own past results and your segment, not a global average.
1. Track user behavior properly
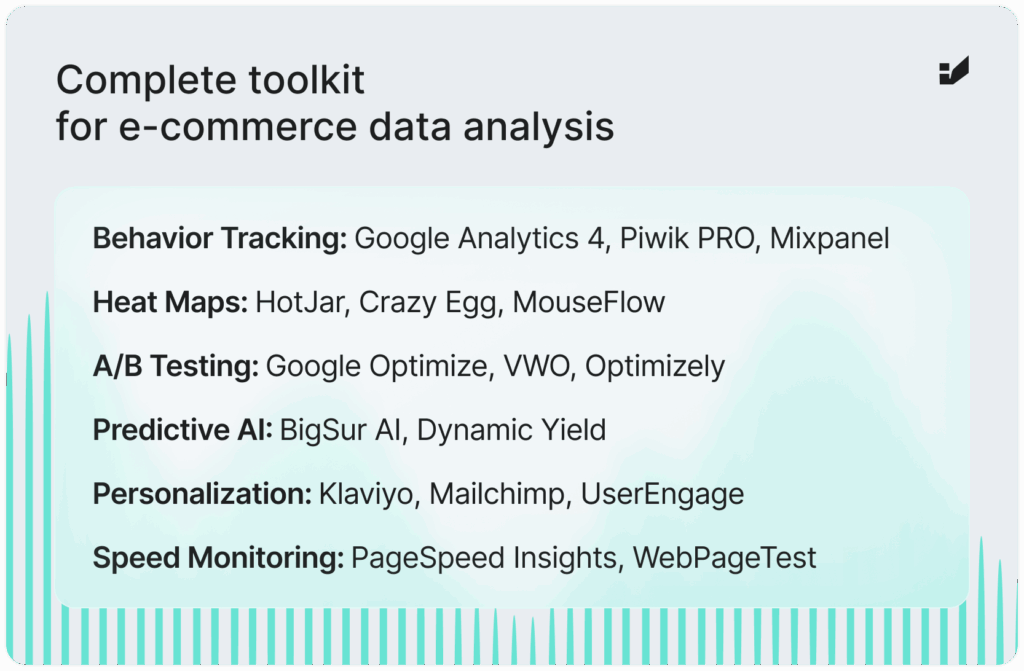
Everything else depends on reliable data. Google Analytics 4, Piwik PRO and Mixpanel show how users move through your store and where they leave.
What to track:
- GA4 e-commerce events: view_item_list, view_item, add_to_cart, begin_checkout, add_shipping_info, add_payment_info, purchase;
- clicks on key elements such as size selectors, filters and “Add to cart”;
- scroll depth and engagement on product pages;
- on-site search terms, especially searches with no results;
- drop-off between funnel steps, by device and traffic source.
Tip: before analysing anything, audit your tracking. Duplicate purchase events, missing transaction IDs or consent-mode gaps can distort conversion rates by several percentage points.
2. Use heatmaps and session recordings
Heatmaps and recordings show what numbers can’t: where people click, how far they scroll and where they hesitate. Microsoft Clarity (free), Hotjar, Crazy Egg and Mouseflow are common choices.
- Click maps: clicks on elements that aren’t clickable, such as product images or icons, point to unmet expectations.
- Scroll maps: show whether key content and CTAs are seen at all, especially on mobile.
- Rage and dead clicks: repeated clicks with no response suggest broken elements or unclear design.
- Recordings of drop-offs: watch sessions that end at the step with the highest abandonment.
3. A/B test changes before rolling them out
A/B testing replaces opinions with evidence. Google Optimize was shut down in September 2023; today’s options include VWO, Optimizely, AB Tasty and Convert.
What to test: CTA text and placement, product page layout, photo style and number, delivery information, form fields, how promotions are presented.
Testing rules:
- Start with a hypothesis based on data: “Showing delivery costs on the product page will reduce checkout abandonment.”
- Calculate the sample size you need before starting, and don’t stop the test early when results look good.
- Run tests for at least one to two full business cycles (usually two weeks or more) to account for weekday and payday effects.
- Change one thing at a time, or use a multivariate test when you have enough traffic.
- Measure revenue per visitor, not only conversion rate, so that a test doesn’t win by lowering order value.
Small cosmetic changes such as button colour rarely matter on their own. Contrast and visibility do; so do clarity of information and trust.
4. Optimize the conversion funnel
Funnel reports in GA4 (Explore → Funnel exploration), Adobe Analytics or Mixpanel show where users leave between product view, cart, checkout and purchase.
What to check: drop-off at each step, differences between new and returning users, mobile vs desktop completion, and which traffic sources complete purchases.
Ways to improve:
- keep the cart saved for users who aren’t logged in;
- offer guest checkout;
- show the number of steps and progress;
- use address autocomplete and correct mobile keyboards for each field;
- offer payment methods popular in your market, such as BLIK and fast transfers in Poland, digital wallets and pay-later options.
5. Segment customers and tailor actions
Not every visitor needs the same message. Segment by behavior and value, then act on each segment with tools such as Klaviyo, Mailchimp, Customer.io or your CRM.
| Segment | Example action |
|---|---|
| Cart abandoners | Reminder email or SMS within hours, with the products and any delivery information |
| One-time buyers | Follow-up with complementary products or a reason to return |
| High-value / VIP customers | Early access, loyalty benefits, dedicated support |
| Category fans | Recommendations and alerts for new products in that category |
| Lapsing customers | Win-back campaign before they become inactive |
6. Use predictive analytics
Predictive models estimate what a customer is likely to do next. GA4 offers predictive metrics such as purchase probability and churn probability once your property has enough data; Klaviyo, Dynamic Yield and similar tools predict next order date, lifetime value and product affinity.
- build audiences of users likely to buy in the next seven days for remarketing;
- trigger retention campaigns for customers with high churn probability;
- recommend complementary products based on cart contents;
- send messages when each customer is most likely to engage.
Note on pricing: if you personalise prices using automated decision-making, EU consumer law requires you to tell customers. Start with recommendations rather than dynamic pricing.
7. Monitor and improve site speed
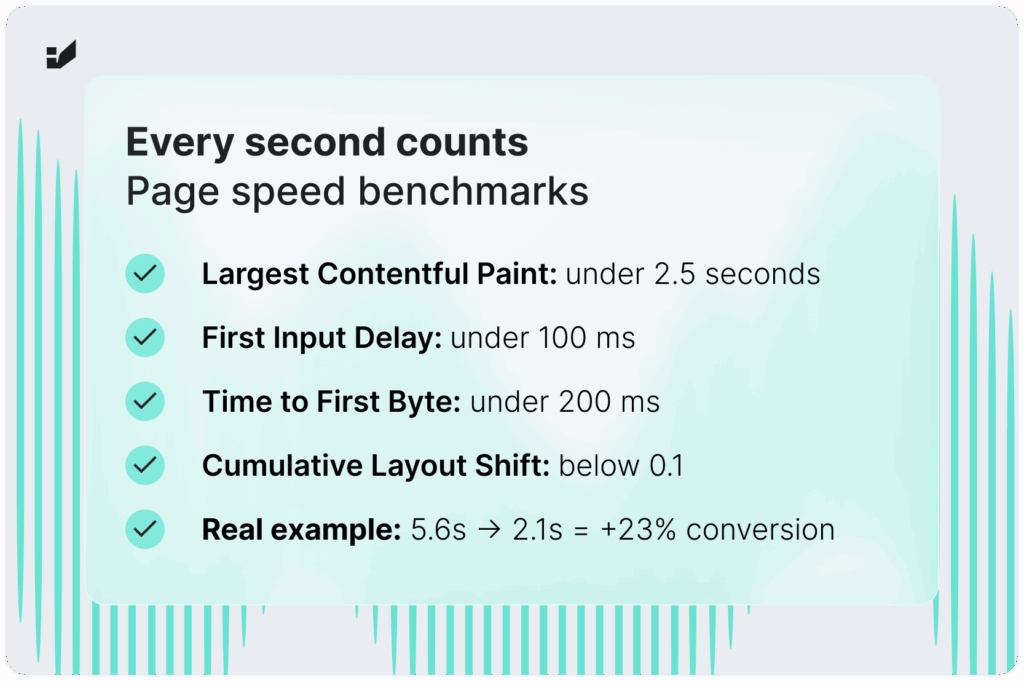
Speed directly affects revenue. In the Deloitte study Milliseconds Make Millions, commissioned by Google, a 0.1-second improvement in mobile site speed increased retail conversions by 8.4% and average order value by 9.2%.
| Metric | What it measures | Good value |
|---|---|---|
| Largest Contentful Paint (LCP) | Loading of the main content | ≤ 2.5 s |
| Interaction to Next Paint (INP) | Responsiveness to clicks and taps (replaced FID in March 2024) | ≤ 200 ms |
| Cumulative Layout Shift (CLS) | Visual stability | ≤ 0.1 |
| Time to First Byte (TTFB) | Server response (diagnostic, not a Core Web Vital) | ≤ 0.8 s |
Thresholds from Google’s Web Vitals and TTFB documentation, measured at the 75th percentile of real visits. Check field data in PageSpeed Insights and the Core Web Vitals report in Search Console, not only lab tests.
Optimization tips: serve images in WebP or AVIF at the right size, lazy-load off-screen images, remove unused JavaScript and third-party scripts, use a CDN and caching, render key content on the server and limit web fonts.
8. Improve product pages
The product page is where most purchase decisions are made. Use data (scroll maps, on-site search, customer questions, returns reasons) to find what’s missing.
- several high-quality photos, including scale, detail and in-use shots; video where it helps;
- a clear price, availability and delivery date above the fold;
- specifications in a scannable table, plus a size chart or fit guidance where relevant;
- answers to the questions customers actually ask, taken from support and reviews;
- a description written for the buyer’s situation, not only a list of features.
Product pages also need to work for AI shopping assistants, which read the visible page and product data. See product descriptions ready for AI search.
9. Simplify the checkout
About 70% of online shopping carts are abandoned, according to Baymard Institute’s average of dozens of studies. The most common reason is unexpected extra costs, such as shipping, taxes and fees; forced account creation and a long or complicated checkout are also near the top. Baymard estimates that large e-commerce sites can increase conversion by about 35% through better checkout design alone.
- show delivery costs and dates early, ideally on the product page;
- allow guest checkout and offer account creation after the purchase;
- ask only for the fields you need;
- validate fields inline and keep entered data after errors;
- show trust signals near the payment step: secure payment, returns policy, contact details.
Lead the rankings. Shape the AI results.
10. Use social proof
Reviews reduce uncertainty. Research by Northwestern University’s Spiegel Research Center found that products with reviews were far more likely to be purchased than products without, with the biggest jump coming from the first few reviews.
- collect reviews automatically after delivery, and include photo reviews;
- show the rating and number of reviews near the price;
- respond to negative reviews publicly and constructively;
- add trust badges, awards and “bought X times this week” only if the data is real.
Use only genuine reviews and endorsements. Fake or selectively filtered reviews are prohibited under EU and UK consumer law.
11. Personalize the shopping experience
Personalization uses behavioral data to show each visitor what’s most relevant: recommended products, recently viewed items, category-based banners or tailored email content.
- start with simple rules: recently viewed, frequently bought together, best-sellers in a category;
- personalise on-site search results and category sorting;
- test every personalization against a control group to confirm it actually lifts revenue;
- respect consent: personalization based on tracking must follow your cookie and privacy settings.
12. Monitor key metrics continuously
Conversion optimization is a process, not a project. Build a dashboard (for example in Looker Studio) and review it weekly.
| Metric | Why it matters |
|---|---|
| Conversion rate by device and channel | Shows where to focus; mobile usually converts lower |
| Add-to-cart rate | Measures product page effectiveness |
| Checkout abandonment rate | Measures checkout friction |
| Average order value and revenue per visitor | Prevents optimizing conversion at the expense of revenue |
| Core Web Vitals (field data) | Tracks speed regressions after releases |
| Returning customer rate | Shows whether you’re building loyalty |
Set alerts for sudden drops, which are often caused by tracking errors, payment outages or a slow release, not by customers changing their behavior.
What’s next for e-commerce analytics?
- Server-side and consent-aware tracking, to keep data reliable as browsers and regulation limit cookies.
- AI-assisted analysis that flags anomalies and suggests hypotheses, while humans decide what to test.
- AI search as a sales channel. Visits from AI assistants still make up a small share of traffic, but they converted 31% better than other traffic in Adobe’s US retail data for holiday 2025. Track them as a separate channel in GA4.
- Agentic commerce, where assistants compare and buy on the user’s behalf, which makes accurate product data, prices and availability even more important.
See also metrics that matter in AI search and intent-based search.
Boost sales with SEO + GEO.
FAQ: e-commerce conversion optimization
What is the average e-commerce conversion rate?
About 2–3%, depending on the dataset. IRP Commerce recorded 2.26% in July 2026 and Dynamic Yield reports a 2.72% global average. The top 10% of Shopify stores convert at about 4.7% or more.
What is a good conversion rate for an online store?
One that beats your own past performance and your industry average. Food and beauty stores often exceed 4–5%, while furniture, electronics and luxury stores convert lower because purchases are larger and more considered.
Why do customers abandon their carts?
The most common reason is unexpected extra costs such as shipping, taxes and fees. Forced account creation, slow delivery, a long checkout and lack of trust are also frequent reasons, according to Baymard Institute.
How much does site speed affect conversions?
A lot. In a Deloitte study commissioned by Google, a 0.1-second improvement in mobile speed increased retail conversions by 8.4% and average order value by 9.2%.
How long should an A/B test run?
Until it reaches the sample size calculated before the test, and for at least one or two full business cycles, usually two weeks or more. Stopping as soon as results look positive leads to false winners.
Which tools do I need to start?
GA4 with e-commerce events for the funnel, a free heatmap tool such as Microsoft Clarity, PageSpeed Insights and Search Console for speed, and an A/B testing tool such as VWO, Optimizely or AB Tasty once you have enough traffic.
Sources
- Blend Commerce: E-commerce conversion rate benchmarks 2026 (IRP Commerce, Dynamic Yield) (Sep 2026)
- Eightx: Average conversion rate by e-commerce vertical 2026 (Littledata) (2026)
- Baymard Institute: Cart abandonment rate statistics
- web.dev: Milliseconds make millions (Deloitte for Google)
- web.dev: Web Vitals
- web.dev: Time to First Byte (TTFB)
- Google Analytics Help: Google Optimize sunset
- Google Analytics Help: Predictive metrics
- Spiegel Research Center: How online reviews influence sales
- Adobe: AI-driven traffic surges across industries
About the author: This article was prepared by the Insightland SEO and GEO team. Insightland is a Wrocław-based agency, part of the Hexe Capital Tech Hub, that connects business, tech and data: SEO and GEO, performance marketing, UX and analytics, and SEO and AI training. Contact us.