Attribution analysis or how to measure successfully

The e-commerce market is among the most dynamically developing markets in Poland. In 2020, the Polish e-commerce grew by more than 30 percent as compared to 2019. The previous year, the figure stood at 25 percent. Many market experts say the pandemic has contributed to the elevated growth rate. They forecast this trend to continue also in the post-pandemic future. A new and considerable group of Internet users has appeared on the market, who despite having tried online shopping for the first time out of compulsion, declare in vast majority to keep this habit going permanently.
In Poland, thousands of new entities selling goods on the Internet emerge every year. While most of them will be Allegro or OLX stores, it is reasonable to assume that some of the newly created entities are regular e-commerce stores. In addition, following the stationary stores’ shutdown, many brands have introduced significant price reductions in online stores. In the struggle for customers and at the same time trying to clear their stock, they have been forced to lower prices even further and more often.

All these elements make one of the key aspects of running an e-commerce business, which is to analyze the effectiveness of operations performed both onsite (UX optimization) and offsite (advertising campaigns).
POWERFUL WAYS TO ANALYZE ONLINE ADVERTISING CAMPAIGNS
When it comes to advertising campaign effectiveness analysis, there have always been certain parameters treated with devotion. These are the metrics by which agencies are held accountable; they are the success benchmarks in case studies, and the outcomes we brag about at industry conferences.
Among these parameters, perhaps one of the best known and the one most closely associated with online advertising is CTR — click through rate. It is a metric which indicates the number of clicks on a given ad format per its 1,000 impressions on end-users’ screens. Striving for the highest possible CTR resulted in various distortions, related to the creation of formats like TopLayer (annoying escaping hashes in aggressive formats) or controversial boxes, e.g. with bouncing breasts and “Breast” caption on the Internet (the banner took you to the website of a brokerage house.) And while CRTs scored high on such options, Bounce Rate collected even higher results.
Another easy to be misrepresented indicator was the number of likes under Facebook posts. Brands competed with each other on the number of likes and made rankings based on this particular parameter. And again, this was often a case of distortion. Brands (or agencies serving them) created hundreds of exactly the same posts: cats, kittens, thanks God it’s Friday. Posts which were meaningless, contributing nothing, and certainly not building a relationship with the brand.
Conversion Rate is another indicator.It represents the percentage of people who performed a specific activity desired by the marketer: signing up for a newsletter, filling in a contact form or – most often – making a transaction. It is the basic measure of every e-commerce success. Its value translates directly into money earned. Thus, considering it as a sort of success indicator is quite reasonable. Yet, there is a key problem in analyzing the value of Conversion Rate, i.e. most marketers analyze effectiveness results based on the last session. And that is where the stumbling blocks begin, because not many of us make a purchase in a single visit to an online store or after a single interaction with a brand or contact with a given commodity.
Depending on the product, the purchase process may last from a day to even several weeks. During this time, the customer moves through several stages: learning about the offer generally available on the market, verifying product parameters, narrowing down the number of options considered until the final purchase. This is called the Customer Journey. In its course, the user visits different sites, returns to the more interesting ones, looks into Google a few times, clicks on ads for products of interest on the web.
Consequently, looking at the user solely through the lens of their last visit (or even their last non-direct visit) leads to many flawed decision-makings.
WHY DO ADS THAT SELL ACTUALLY NOT SELL?
If we left in the media mix only those campaigns that deliver conversions, we would quickly find that we stop selling at all. Just like business, online sales rely on the funnel principle. The more you pour in, and thus the more people see your ads, the more chances you have of selling more. Under certain conditions, obviously.
Because if we leave only those ads that sell, we cut off the stream of people and stop communicating with new potential customers. Quickly, we will also come to the wrong conclusion that prospecting campaigns are pointless. After all, they bring no sales. And since it sells best to people who have “already been to us,” we will focus on remarketing. Unfortunately, this leads to nowhere.
In order to successfully create online advertising campaigns, we should analyze them in the long term using attribution. Attribution means assigning certain properties to someone or something. In the context of marketing and conversion, it is assigning individual visits involved in the buying process to a given conversion. Attribution allows you to analyze which media/sources and to what extent they participated in the sale.
ATTRIBUTION ANALYSIS MODELS IN ONLINE ADVERTISING
There are a number of methods for source analysis in the context of attribution. You can use your own solutions, based on data about each user and applying Markov or Shapley models to arrive at conclusions. You can also use third party tools.
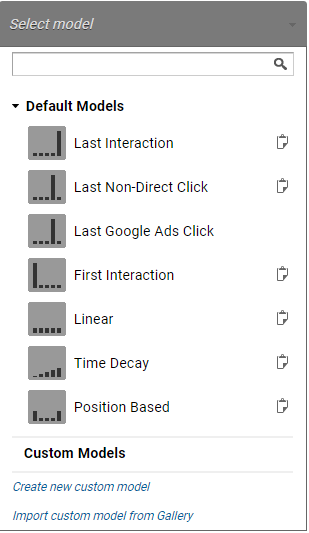
Finally, you can rely on solutions offered by Google Analytics, where attribution reports can be found under conversions>multichannel paths>attribution model comparison. With GA, you can choose from 6 predefined models:
- last click – a model based on assigning all the glory to the last source, and a variation of it;
- last non-direct click – just like the previous one, but it will assign the glory to the last non-direct known source;
- time decoy – a model based on time elapsed, i.e. the more recent the visit, the more contribution it will assign to the source;
- first interaction – as the name suggests, all the credit is assigned to the first source;
- position-based – a model where we equally weight the source of the first and last visit – 40 percent each, and the middle visits will receive a total of 20 percent (if there were 5, each will receive 4 percent of conversion);
- linear – just like in the old days: everyone equally.
GA360 also includes a DataDriven model, which is considered to be the most advanced. It is based on the website user’s activity within particular visits and on the time spent there. Therefore, it appears to be the most impartial and realistically related to the user’s purchase intention.
Google Analytics provides another important functionality, i.e. the ability to create your own models, based on the previously described ones. We can, for example, create a hybrid which rewards the first visit and middle visits. With the feature of creating your own segments, you may also analyze visit sequences, e.g. the fact that a visit stemming from organic traffic was preceded by a visit from paid activities. This way you can investigate correlations between various sources.
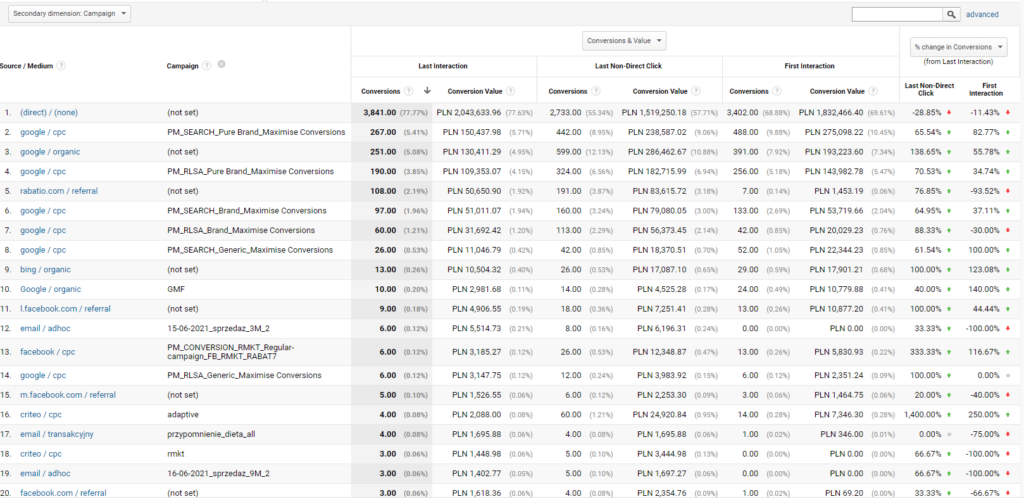
Another significant feature of GA allows us to compare three different models at the same time. So we can verify which activities performed better at particular stages of the purchase process: prospecting actions (e.g. Organic for generic phrases, pDPA campaigns, Google Ads Discovery), middle or closing sales (e.g. remarketing campaigns directed at users with a product in the cart, mailing reminding about the abandoned cart, or often Organic for branded phrases.)
There are also three options available for analysis in GA: Conversions & CPA, Conversion Value & ROAS and Conversions & Values. The last option seems the best, because it allows us to have a look at both important parameters – the number and value of conversions, and after adding the cost, we can calculate all the necessary quality parameters.
TOP–DOWN APPROACH
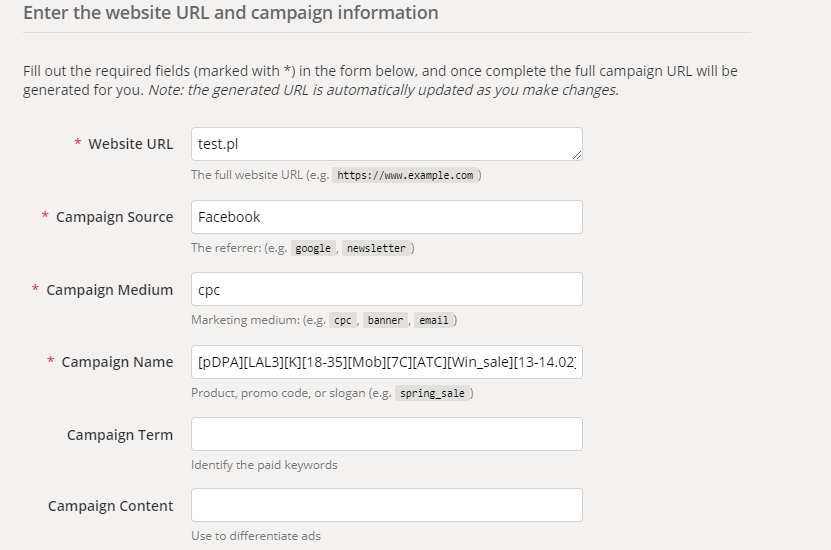
Key components of the attribution analysis process are tagging advertising activities properly and assigning costs to particular campaigns, advertising groups or even specific creations.
Tagging advertising activities properly
The point of attribution is to estimate the effectiveness of individual advertising activities. This means that keeping the analysis on the general level of the entire channel (Facebook Ads, Google Ads, Organic or Affiliation) will not meet our expectations. Analysis needs to be carried out at a deeper level, at least of a single campaign or advertising group. To be able to conduct such an analysis, the critical element is to name individual activities in such a way, so that they are easily identifiable, i.e. they convey knowledge about the campaign structure.
In case of GA, reports related to multi-channel paths are available only in a dedicated part of the tool: Conversions > Multi-Channel Funnels. This means that the analyses available there cannot be performed within custom reports. We cannot design a query in a custom way, add own parameters, and then compare campaigns within particular attribution models.
WHY IS IT SO IMPORTANT?
We can use only two dimensions within the model comparison report: one primary and one supplementary. We can thus set a source/medium as the primary one to determine the basic level of allocation, and as the supplementary one, e.g. campaign, ad group, creation, etc. But only one.
This is why proper tagging of activities is of such importance. We have only one dimension to convey as much information about the ad structure as possible. The parameters to be included in the given parameter should be:
- target group: sex, age, conversion window type
- optimization method: CPA, CPC, ROAS, reach
- stage of the purchase process: prospecting, remarketing
- nature of the campaign: branding, sale, new collection
- device: mobile, desktop
- product group: footwear, TVs, bikes, push scooters
This allows us to analyze and compare the results of individual campaigns on the GA data level, and to identify elements that may contribute to a weaker conversion rates. For example, by comparing two remarketing campaigns optimized for conversion cost and targeting women 18-30, we can determine that using a 3-day conversion window contributes less to a purchase than a 1-day window, or in the case of prospecting campaigns, those optimized for maximum ROAS perform better than Target CPA.
EFFECTIVENESS IS A QUEEN (EFFECTIVENESS IS KING, BUT EFFICIENCY IS GOD)
Another essential component for attribution analyses is the appropriate allocation of costs to particular campaigns. Let’s remember that the effectiveness of activities (sales) is a key element in marketing. But even more important is its effectiveness, meaning the financial aspect of obtaining a given sale. It is easy to imagine two campaigns contributing to 100 transactions. However, if we spend PLN 10,000 on one campaign and PLN 50,000 on the other, then even though both campaigns are equally effective, one is 5 times more efficient.
Again, it’s worth turning back to GA. It is only able to automatically retrieve cost data for Google Ads (assuming the accounts are properly linked.) In the case of other sources you can either manually assign the data in Excel or try to transfer the data from individual systems to GA.
All of the above elements make up the effectiveness analysis. Usually, the primary parameter used to evaluate campaigns is ROAS, i.e. Return on Ad Spend. Calculating it is very simple: all you need to do is compare the revenue generated by a given campaign (within the selected attribution model) to the costs incurred for that campaign. In comparing the results from each source/campaign/ad group, you can then easily estimate which campaigns do well and which perform poorly, which should be changed, and which should end altogether.
Aside from analyzing individual campaigns, we should also keep an eye on the distribution of the sources number and value in each stage of the purchase path. This means making comparisons as to whether the number of sources, but also the costs and revenues generated by them, are similar across stages: acquisition, midpoint, sales closing stage. It is important not to have significant differences between them. Because in the long run, this may lead in the worst case scenario to excessive reduction of the initial stream or lack of sources closing the sale.
Summary of the stages in the attribution analysis process:
- Tagging activities properly.
- Data collection.
- Assigning cost data to particular activities.
- Comparing data collected within a number of attribution models.
- Evaluating each campaign using ROAS, CPA.
- Evaluating the number of sources, value of generated revenue in each path element.
With new e-commerce businesses on the rise, attribution analysis is proving to be the key to literally leaving the competition behind. Attribution analysis is not just about knowing who buys and why they buy, but also how they buy, and – the key to profitability analysis – how much the process of making a purchase ultimately costs the business. With such information it is possible to accurately estimate expenditures and invest in those channels which prove to be effective. This is true not only for the transactions made via them, but also in terms of taking such actions that will lead the customer to the shopping cart. After all, it is the value of the shopping cart, which becomes the key success factor.