How to use Chrome DevTools for SEO?

Google Chrome DevTools is a suite of free tools built directly into the Google Chrome browser in the form of built-in features, as well as additional modules (available for installation at https://chrome.google.com/webstore/) for testing, analyzing and debugging the code of websites and web applications. Chrome DevTools is one of the essential tools for developers, SEOs, and web analysts.
This article describes the features of Chrome DevTools that are particularly useful for an SEO specialist.
Contents
- 1 How to open Chrome DevTools?
- 2 Inspector mode
- 3 Device mode
- 4 Elements
- 5 Console
- 6 Network
- 7 Performance
- 8 Summary
How to open Chrome DevTools?
Users expect quick access to different parts of the DevTools interface. There are many ways to open it in the browser.
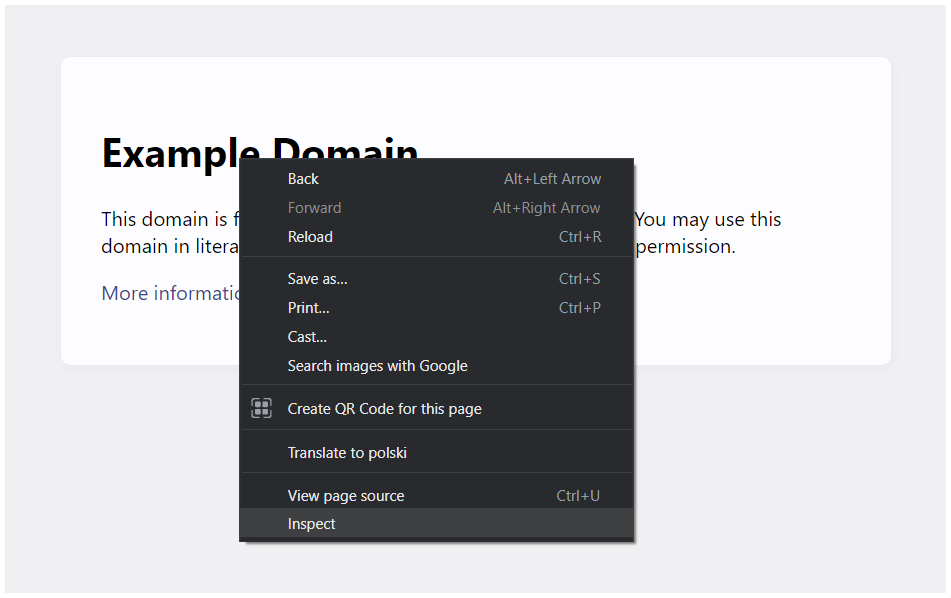
The first and most basic way is to right-click on the analyzed page element to expand the context menu and select “Inspect”. This will open the “Elements” tab in DevTools, where you can analyze the elements in the DOM tree.
Another way to open Chrome DevTools is to select an option from the browser’s context menu. To do this, press the button with the symbol of three vertically aligned dots in the upper right corner of the browser. In the second step, find the “More Tools” option in the context menu that opens, and after hovering over it, select “Developer Tools” from the submenu that opens. This will open the tool and activate the same panel that the user was displaying the last time they closed DevTools.
Windows, Linux ChromeOS
- “Elements” Panel – CTRL + SHIFT + C
- “Console” Panel – CTRL + SHIFT + J
- Recently closed panel – F12 / CTRL + SHIFT + I
MacOS
- “Elements” Panel – CMD + OPTION + C
- “Console” Panel – CMD + OPTION + J
- Recently closed panel – F12 / CMD + OPTION + I
Inspector mode – is a feature in Chrome DevTools that allows you to quickly see basic information about the item that the mouse cursor is currently over.

The tool simultaneously locates the element in the HTML code and highlights a portion of it for quick preview by the user. The tool also works the other way around – hovering over a snippet in the DevTools window highlights the element on the page to which the snippet refers.
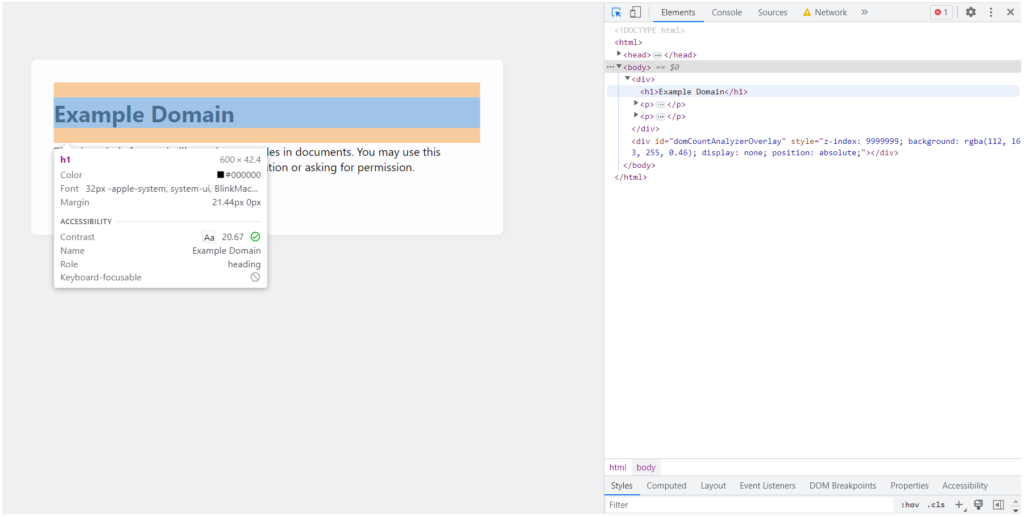
When Inspector mode is enabled (the Inspector icon is highlighted), left-clicking on the inspected element will display information about the element’s CSS styles in Chrome DevTools. This data is displayed below the page code preview window in the “Styles” tab.
The Inspector Mode feature in Chrome DevTools is a tool that is primarily useful for locating hidden elements on a page (e.g., using CSS code). It also provides a great assistance in verifying whether various elements of the site have been implemented correctly.
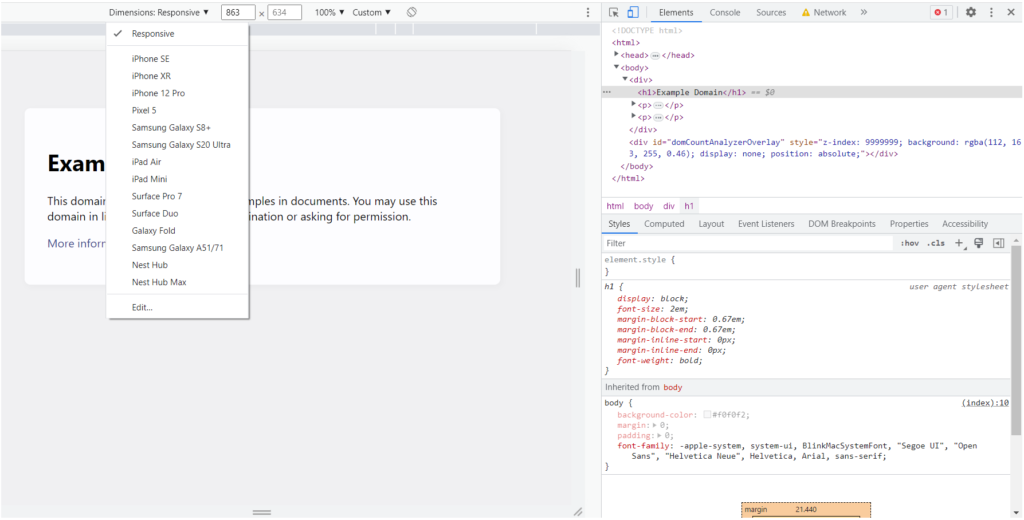
Device mode – allows you to simulate the performance of a website on different resolutions and devices.

This tool allows you to check the layout of a page at any screen height and width. In addition to this basic function, it also provides automatic simulation of the screen resolution of the most popular mobile device models, as well as configuring the window size for your own device.
In addition, Device Mode allows you to limit the speed of your Internet connection to a range appropriate for the device you are simulating.
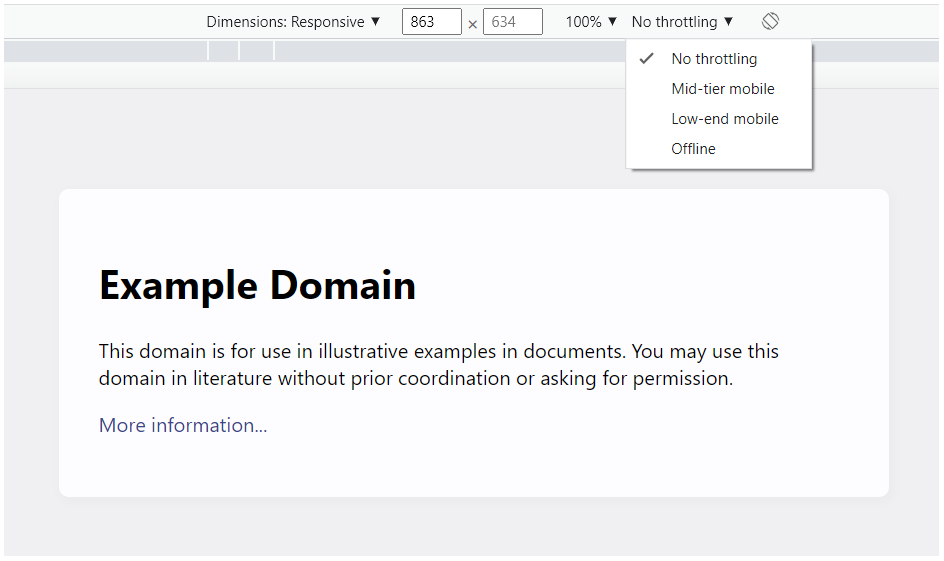
The main advantage of this tool from an SEO’s point of view is the ability to check the page layout for an unlimited number of screen resolutions. This allows you to verify the elements that cause the common problem reported by Google Search Console in the Mobile Usability Report – Clickable elements too close together.
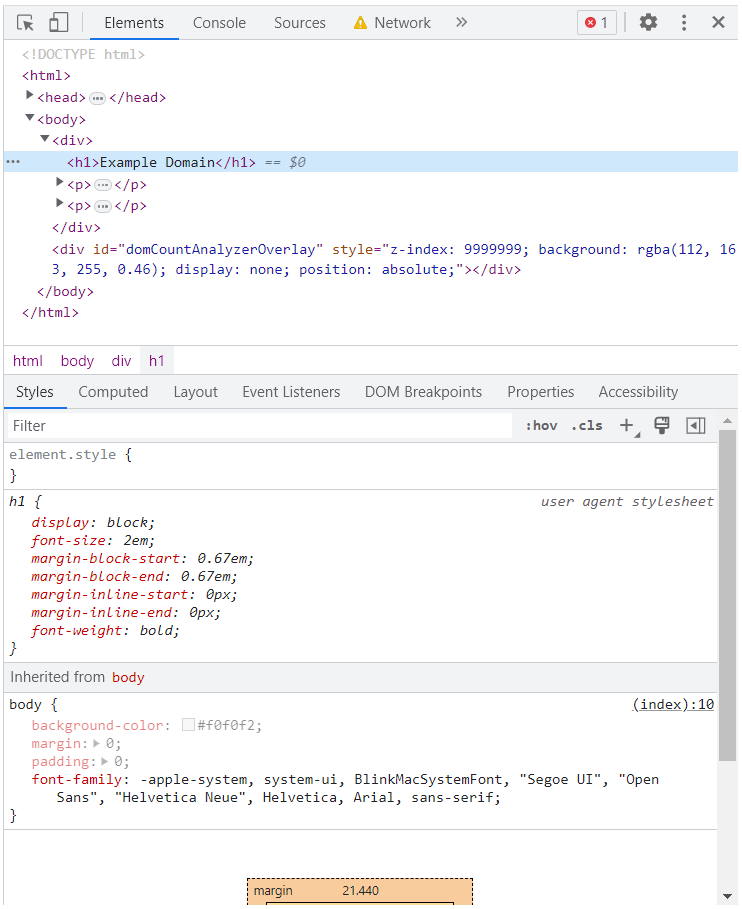
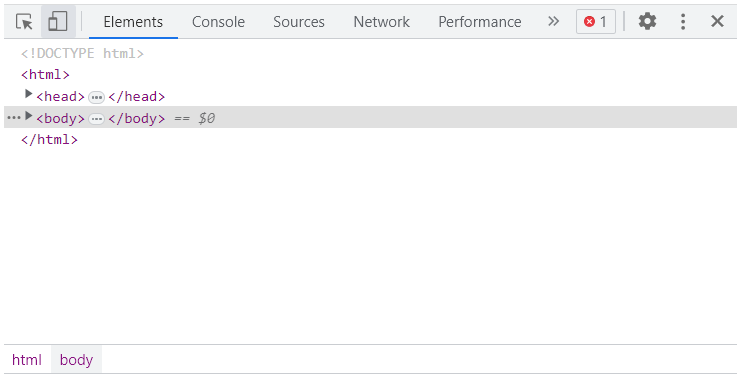
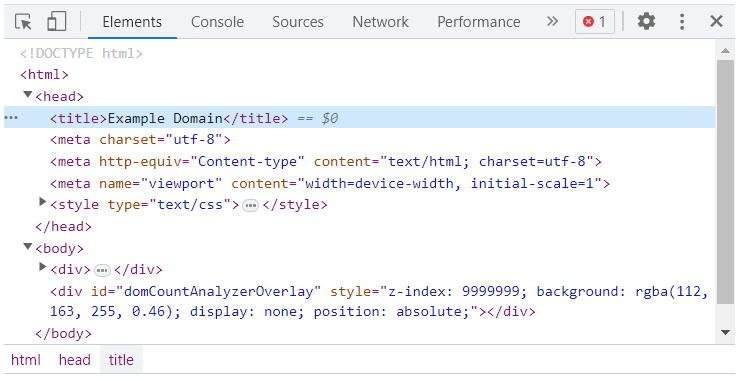
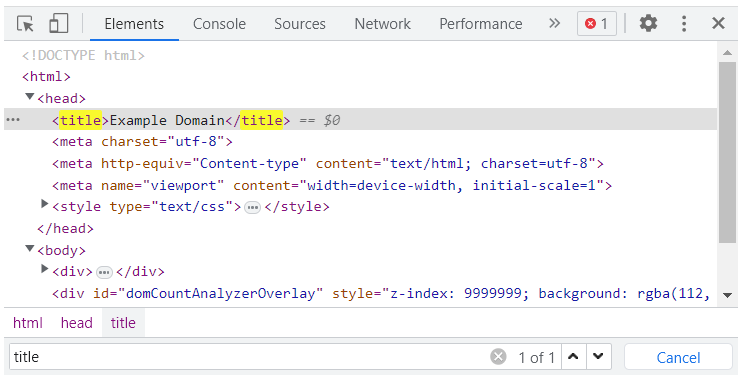
Elements – is a tab in Google Chrome DevTools that allows you to inspect the HTML code of a page in the DOM tree. With this tool, the user can see how each element is nested and also search for individual parts of the code.
The latter option is particularly useful for SEO specialists. This is because it helps to quickly verify the presence of elements such as Schema.org structured data in the code, as well as elements as basic as the <title></title> tag or <meta name=”robots” content=”noindex”>.
To run a search in the “Elements” tab, use CTRL + F. You can then search the HTML code in the search box that opens.
Console – allows you to run JavaScript code while the web page is already fully loaded. This is particularly useful for testing JS code before implementing it directly on the site.
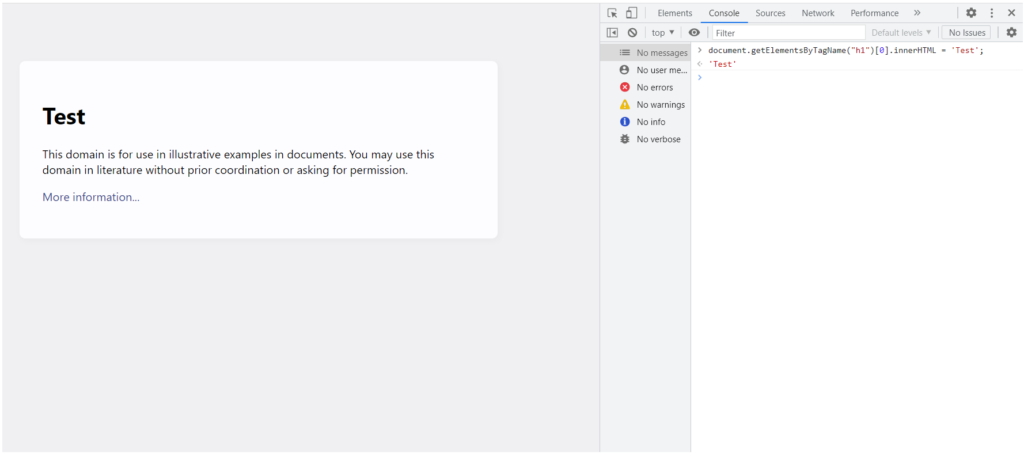
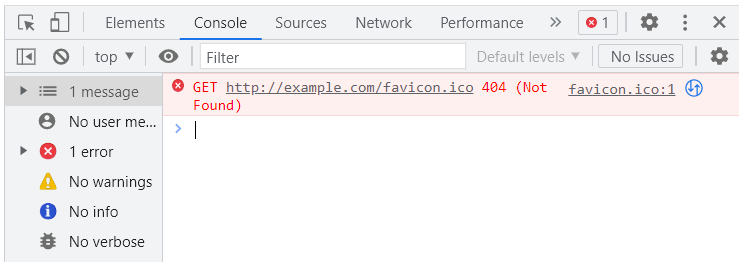
Another very important feature of the Console tab is the ability to display logs and prompts about the operation of JavaScript code. This feature allows the user to verify whether the JS code embedded in the page works properly. For JavaScript errors, the Console tab displays detailed information about the fragment of code that generated the error, as well as the cause of the error.
This is a useful tool in the work of any SEO specialist to verify errors in the performance of the site. This translates directly into the ability to provide detailed implementation recommendations.
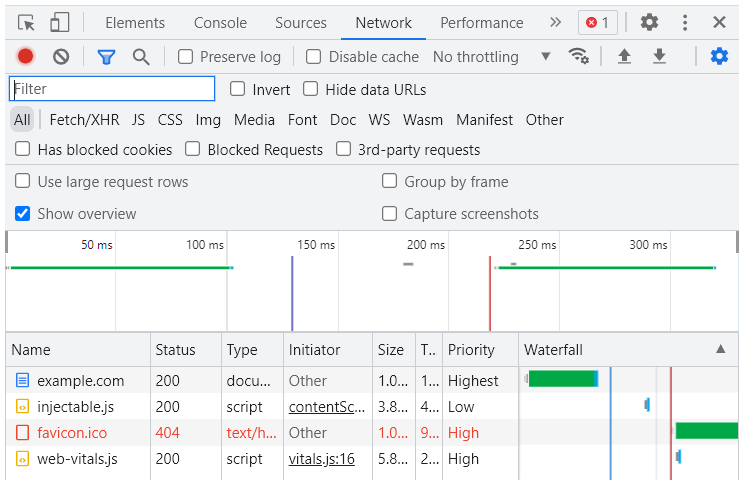
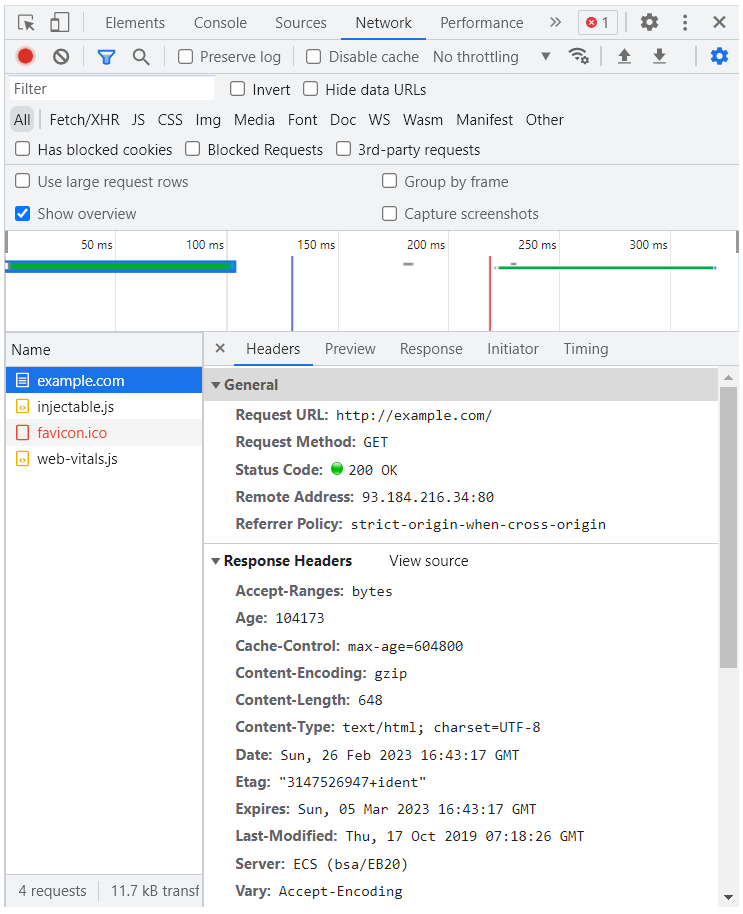
Network – is a tab in DevTools for analyzing the page resources downloaded by the browser. Above all, this tool allows you to:
- verify the status of the requested resources,
- analyze the contents of HTTP headers (both request and response),
- perform waterfall analysis of the downloaded resources,
- simulate loading a page without requesting specific resources,
- simulate page loading with limited Internet bandwidth,
- simulate loading a page without cache.
The “Network” tab in Chrome DevTools is an excellent tool for streamlining the work of an SEO specialist at the level of verifying the proper functioning of specific pages of a website.
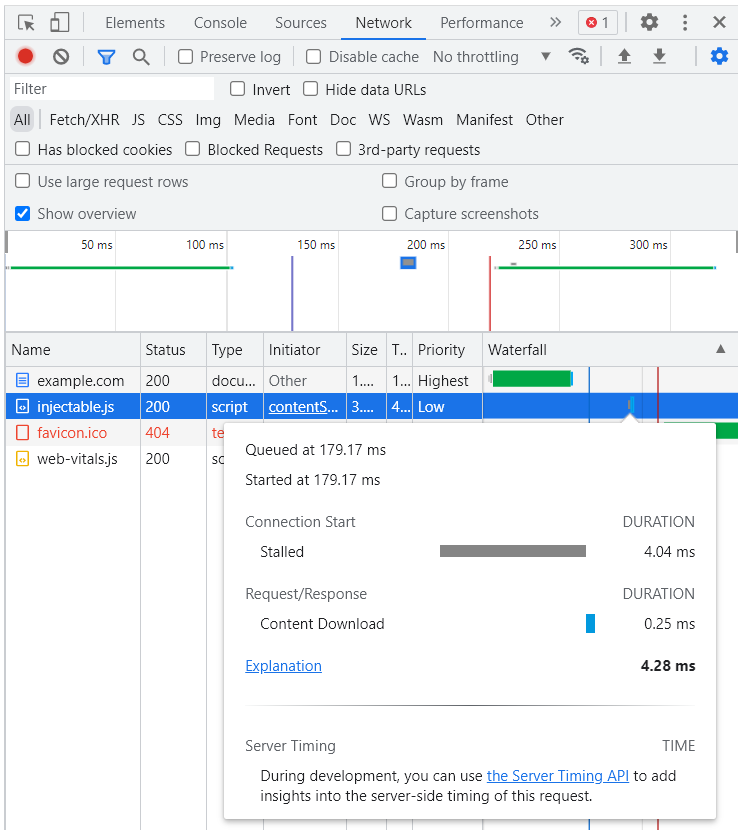
The logs in the “Network” tab represent a table showing the status of the requested resources. It shows the following elements:
- Name – the name of the requested resource,
- Status – the server response code for the requested resource (e.g.: 200, 404, 403),
- Type – the type of the requested resource (e.g.: document, script, png),
- Initiator – it identifies what caused a resource to be requested,
- Time – how long the request took,
- Priority – the download priority of the resource (e.g: Highest, High, Low),
- Waterfall – the order in which resources are loaded.
By left-clicking on the name of the requested resource in the “Name” column of the “Network” tab logs, the user can access data about HTTP request and response headers.
The last column in the “Network” tab logs provides detailed information about the downloading and loading of a specific resource. If you hover your mouse over the row containing the waterfall graph, you can see detailed information about the time the request was sent, how long it took the server to respond, etc.
Simulating the loading of a page without a specific resource is an excellent way to see if blocking or delaying the loading of a specific page resource will affect the overall functionality of the page and the user experience.
To block a browser’s request for a particular resource, locate that resource in the “Name” column of the waterfall table and right-click the name of that resource. Select “Block request URL” from the context menu that opens.
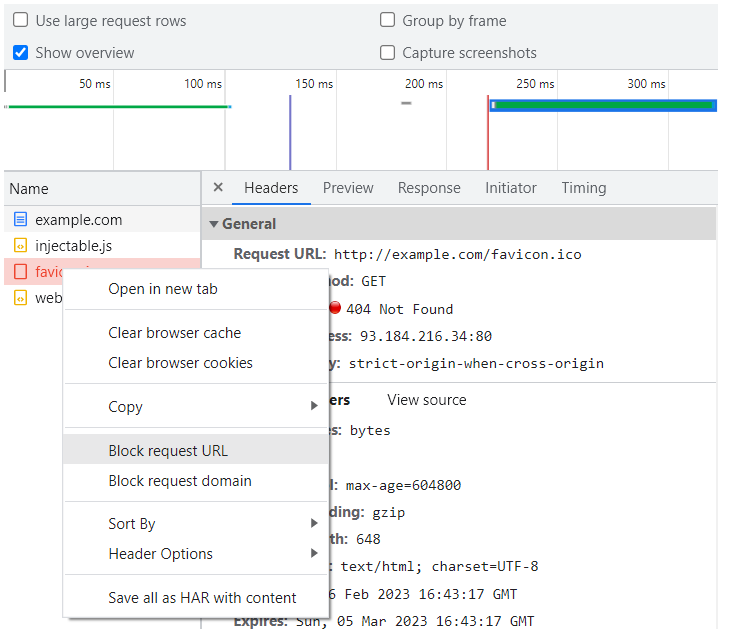
Each time the page is reloaded, the resource will not be requested by the browser until the resource is unchecked in the “Network Request Blocking” tab below the waterfall table, or the current browser session is closed.
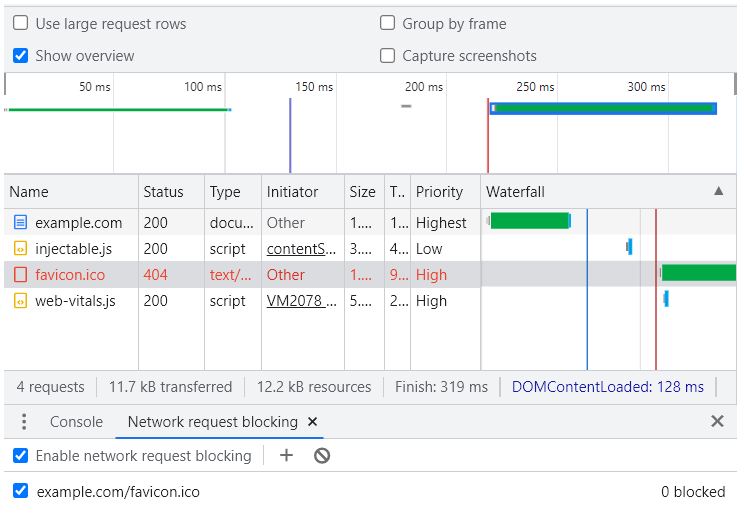
It is also possible to block requests for all URLs of a given domain. To achieve this effect, locate one of the resources belonging to the domain to be blocked in the “Name” column of the waterfall table. In the next step, simply right-click on the name of this resource and select “Block request domain” from the context menu that opens.
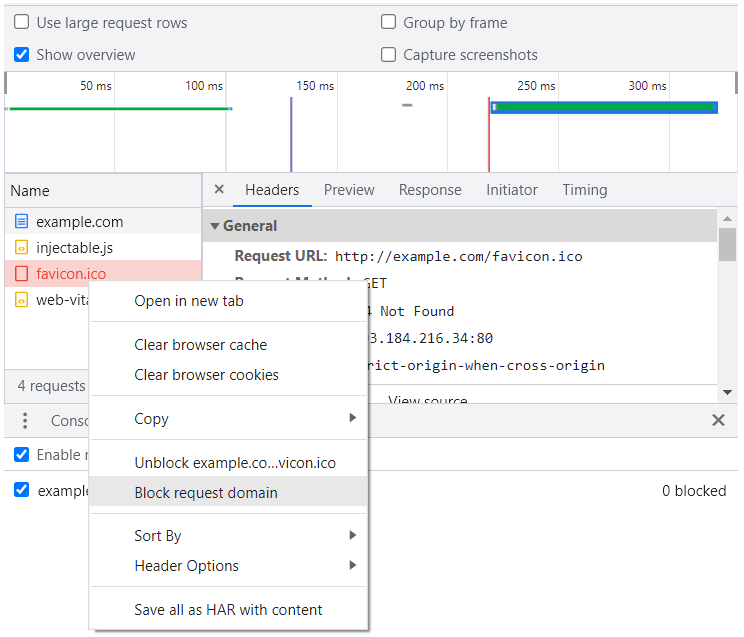
In this way, all resources belonging to the domain will be blocked from browser requests.
Simulating limited internet bandwidth is a useful feature of the “Network” tab, which allows you to assess the website loading speed on devices with slow internet connection speeds (i.e.: smartphones).
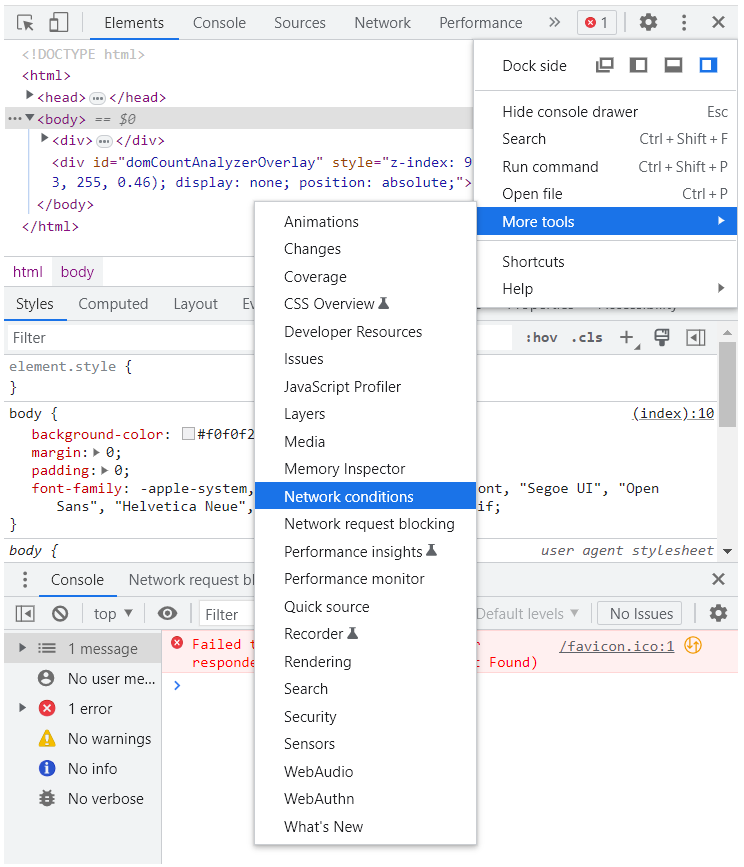
To impose bandwidth restrictions on the browser, locate the menu button (three vertically aligned dots) at the top right part of the DevTools window in the Chrome DevTools tab. Select “More tools” and then “Network conditions” from the context menu that opens.
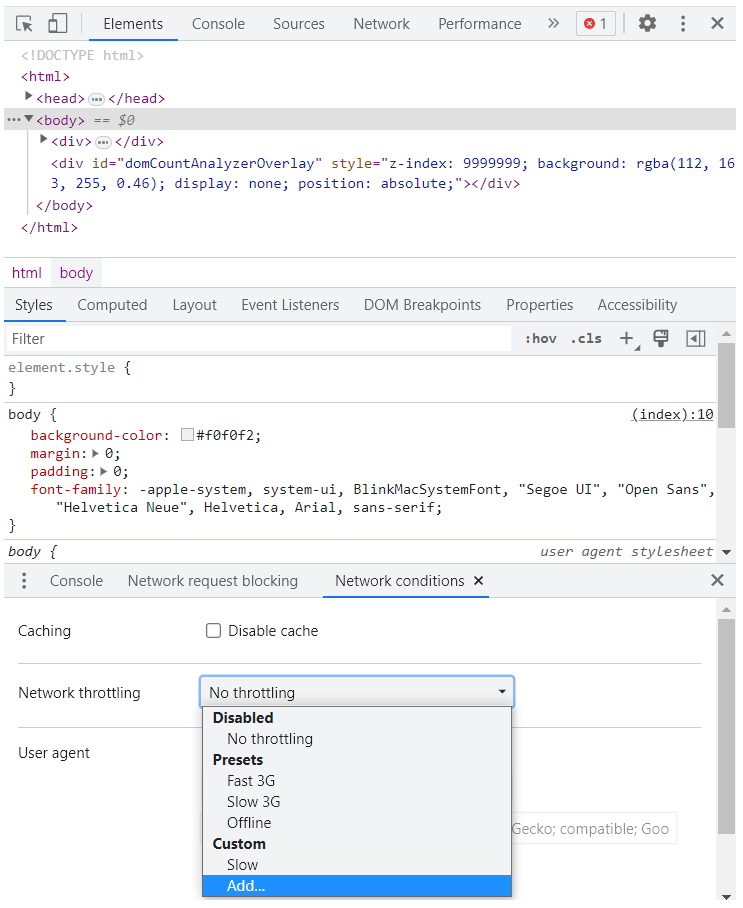
The “Network throttling” feature comes with pre-defined profiles:
- No throttling – no limitation
- Fast 3G – 560 milliseconds of latency and bandwidth reduced to 1.44 Mbps.
- Slow 3G – 2 seconds of request latency and bandwidth reduced to 400 Kbps
- Offline
In addition, users can define their own bandwidth throttling settings.
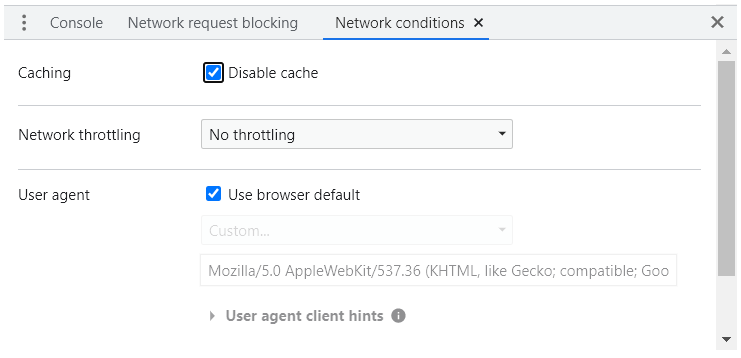
To disable the cache in the browser, select “Disable cache” in the “Network conditions” tab and refresh the page being analyzed.
The “Network tab” is a powerful source of knowledge about the site, for developers, SEO specialists and web analysts Not only does it enable you to identify resources that pose a problem in loading the page or simulate the absence of certain resources, but also to locate problems on the page that generate errors in Google Analytics (e.g.: incorrect assignment of a source to a session).
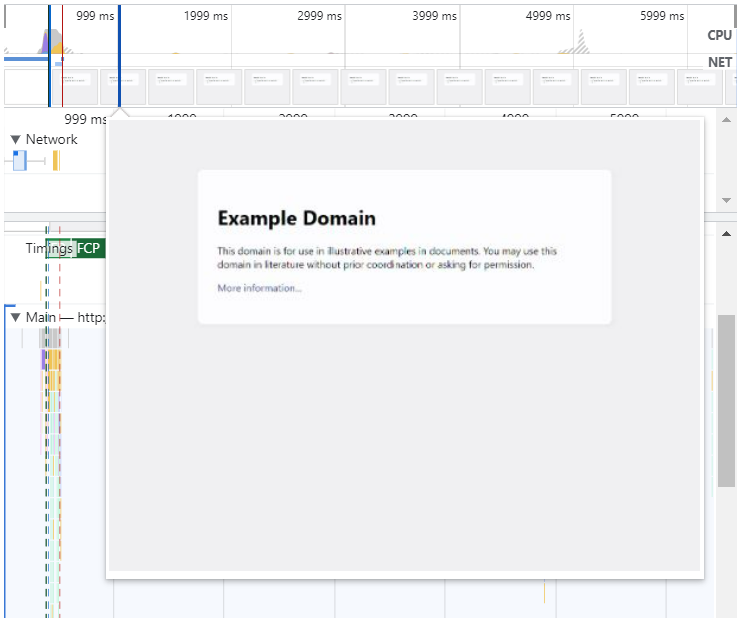
Performance – gives you the ability to see exactly how a web page loads under certain limitations, i.e.: with respect to Internet bandwidth and CPU.
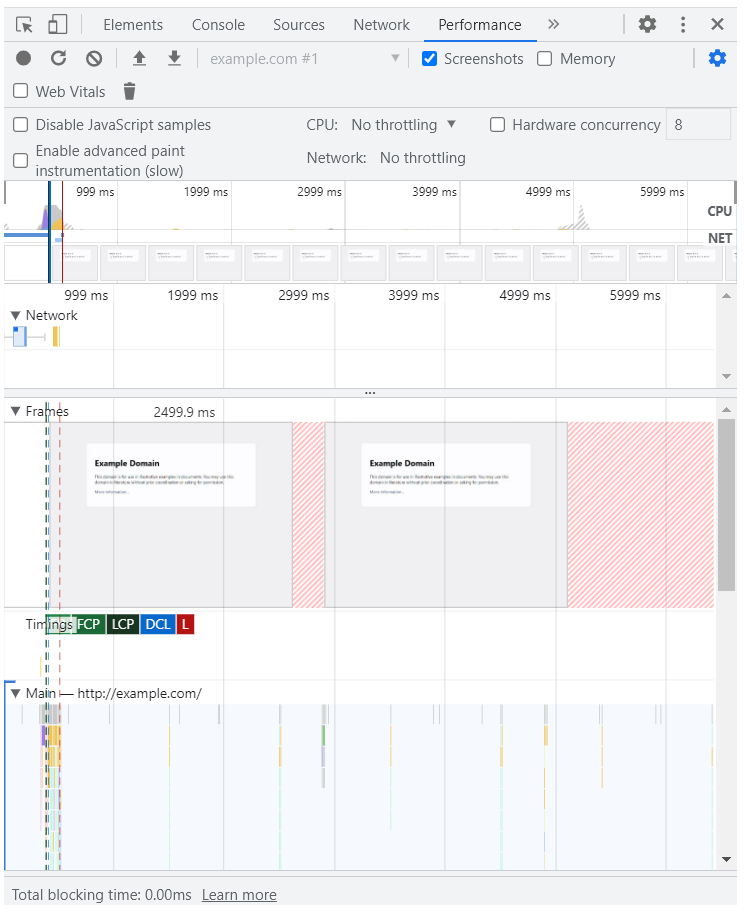
In addition, using this tool, you can determine which page elements have a direct impact on Core Web Vitals metrics (First Contentful Paint, Largest Contentful Paint, Cumulative Layout Shift).
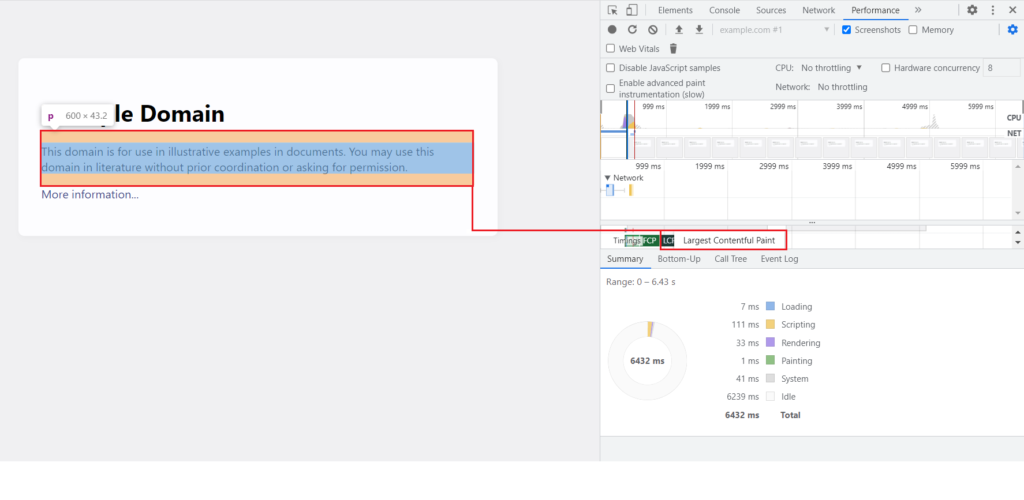
Performance also visualizes the loading of the website frame by frame giving the user the opportunity to preview each of them.
Functions hidden in the “Performance” tab are excellent tools that can be used by the SEO specialist to locate elements affecting Core Web Vitals metrics and also to verify the correct implementation of recommendations to improve these metrics.
The elements outlined in this article are just a fraction of the features provided by Chrome DevTools, which perfectly illustrates how powerful and useful this tool is. Being aware of the features hidden in this free module and knowing how to use them in your everyday work is undoubtedly a great added value for any developer, SEO specialist and web analyst.